Market Outlook
August 30, 2016
Market Cues
Domestic Indices
Chg (%)
(Pts)
(Close)
Indian markets are likely to open flat with positive bias tracking SGX Nifty.
BSE Sensex
0.4
120
27,903
Nifty
0.4
35
8,607
US stock markets climbed on Monday in the wake of comments by top Fed officials
Mid Cap
0.5
64
13,064
that bolstered expectations for an interest rate hike by U.S. central bank this year.
Small Cap
0.1
12
12,499
Advance in U.S. stock markets was led by financials, which stand to gain the most in
an environment of higher interest rates. S&P 500 financial index .SPSY ended 1%
Bankex
0.2
53
22,059
higher; Wells Fargo gained 2.2% and JPMorgan rose more than 1%. Advances
helped Wall Street snap a 3-day losing streak. Report from U.S. Commerce Dept.
Global Indices
Chg (%)
(Pts)
(Close)
showed consumer spending, which a/c’s for over 2/3 of U.S. economic activity, rose
Dow Jones
0.6
108
18,503
for 4th month in July. That reinforced bets of rate rise soon, even as other data
Nasdaq
0.3
13
5,232
showed U.S. inflation remained subdued.
FTSE
0.3
21
6,838
European stocks on Monday finished in negative territory, kicking off week lower as
Nikkei
2.3
377
16,737
rising expectations the U.S. Fed will lift interest rates later this year poked the air out
Hang Seng
(0.4)
(88)
22,821
of a recent rally. Stoxx Europe 600 index SXXP, lost 0.2%, pulling back after 1.1%
climb last week. London markets were closed on account of a holiday.
Shanghai Com
(0.0)
(0)
3,070
After 2-day correction amid consolidation, Indian indices gained strength in last
Advances / Declines
BSE
NSE
hour of trade on Monday with Nifty closing above 8,600 on short covering despite
weak global cues. Reliance Industries, ICICI Bank and Tata Motors contributed more
Advances
1,228
711
than 80% to index gains. Hopes of further monetary easing by Bank of Japan also
Declines
1,482
889
aided sentiment.
Unchanged
196
80
News Analysis
Volumes (` Cr)
MEP Infra gets NHAI toll collection contract in Jharkhand
Detailed analysis on Pg2
BSE
2,921
NSE
16,276
Investor’s Ready Reckoner
Key Domestic & Global Indicators
Net Inflows (` Cr)
Net
Mtd
Ytd
Stock Watch: Latest investment recommendations on 150+ stocks
FII
(305)
7,613
38,495
Refer Pg5 onwards
MFs
60
812
9,600
Top Picks
CMP
Target
Upside
Company
Sector
Rating
Top Gainers
Price (`)
Chg (%)
(`)
(`)
(%)
Amara Raja
Auto/Auto Ancillary
Buy
920
1,076
16.9
Deltacorp
157
8.2
HCL Tech
IT
Buy
757
1,000
32.2
Balkrisind
833
6.6
HDFC Bank
Financials
Accumulate
1,238
1,350
9.0
Centralbk
107
6.5
Bharat Electronics
Capital Goods
Buy
1,215
1,414
16.4
Jktyre
130
6.1
Equitas Holdings
Financials
Buy
177
235
32.5
Laxmimach
4,094
6.1
Navkar Corporation Others
Buy
201
265
32.0
More Top Picks on Pg4
Top Losers
Price (`)
Chg (%)
Key Upcoming Events
Hexaware
198
(5.0)
Previous
Consensus
Date
Region
Event Description
Gvkpil
6
(4.4)
Reading
Expectations
Gati
143
(3.4)
Aug 30 US
Consumer Confidence
(97.3)
97.0
Aug 30 Euro Zone
Euro-Zone Consumer Confidence
(8.5)
(8.5)
Gruh
334
(3.4)
Aug 31 US
Initial Jobless claims
261.0
265.0
Persistent
610
(3.3)
As on August 29, 2016
Sep 01 Germany
PMI Manufacturing
53.60
Sep 01 UK
PMI Manufacturing
48.20
6.(
Market Outlook
August 30, 2016
News Analysis
MEP Infra gets NHAI toll collection contract in Jharkhand
MEP Infrastructure Developers Ltd (MEP) has won its 3rd short term toll collection
project in Jharkhand for 1-year. MEP has bagged this project with an annual
remittance of `87.30cr, payable on weekly basis over the tenure of the project.
MEP has received the letter of acceptance for toll collection rights at Sau Kala toll
plaza on the Aurangabad-Barachatti section of NH-2 in Jharkhand. Operations
would commence from September 14, 2016.
This is the 3rd project of MEP in Jharkhand and now has total of 10 short term toll
projects awarded by NHAI with Authority remittance of `659.61cr/ year.
MEP is an operate-maintain-transfer (OMT) player in the road infrastructure sector
having forayed into engineering, procurement and construction space with
6
hybrid annuity projects in Maharashtra and Gujarat.
Quarterly highlights - Standalone
Particulars (` cr)
Stake (%) Lane kms State
Bid cost (` cr)
NPV (` cr)
Aravali-Kante
74
157 Maharashtra
592
556
Nagpur-Package I
74
134 Maharashtra
531
463
Nagpur-Package II
74
112 Maharashtra
639
587
Kante-Wakad
74
204 Maharashtra
826
805
Talaja-Mahuva
60
182 Gujarat
643
624
Mahuva-Kagavadar
60
40 Gujarat
605
585
Source: Company, Angel Research
MEP currently has 18 operational projects, 14 toll collection projects (25 toll
plazas) in 8 states, 3 OMT projects- covering 1,361.32 lane kms and 9 toll plazas-
and 1 build-operate-transfer project- covering 42 lane km and 5 toll plazas.
Consol. Debt of MEP at FY16-end stands at `2,907cr (reflecting D/E ratio of
28.7x). With Order book of `3,837cr, post the 6 Hybrid project order wins, we
expect more pressure to be seen on MEP’s balance sheet. Till the time the
company pursues the Infrastructure Investment Trust (InvIT), we expect the MEP
stock to remain under pressure, owing to cash flow mismatches.
We continue to maintain our Neutral rating on the stock.
Economic and Political News
New process to check, finance central schemes from FY18
Centre revises quantity of red sanders wood exports by Andhra
Jaitley seeks funding for NIIF from US, UK
RBI balance sheet expands 12.25% in FY16
Corporate News
Monsanto approaches Delhi HC against CCI decision
Zee Entertainment in talks to sell its sports bouquet
Airtel cuts data price by 33% as Jio trial offer hurts data growth
Shree Renuka Sugars to exit Brazil partially to reduce debt
Market Outlook
August 30, 2016
Quarterly Bloomberg Brokers Consensus Estimate
Bharat Petroleum Corp Ltd - Sep 1, 2016
Particulars (` cr)
1QFY17E
1QFY16
y-o-y (%)
4QFY16 q-o-q (%)
Net sales
49,977
51,917
(3.7)
44,146
13.2
EBITDA
3,485
3,818
(8.7)
3,490
(0.1)
EBITDA margin (%)
7.0
7.4
7.9
Net profit
2,172
2,376
(8.6)
2,549
(14.8)
Market Outlook
August 30, 2016
Top Picks ★★★★★
Large Cap
Market Cap
CMP
Target
Upside
Company
Rationale
(` Cr)
(`)
(`)
(%)
To outpace battery industry growth due to better technological
Amara Raja Batteries
15,718
920
1,076
16.9
products leading to market share gains in both the automotive
OEM and replacement segments.
Uptick in defense capex by government, coupled with BELs
Bharat Electronics
29,158
1,215
1,414
16.4
strong market positioning, indicate good times ahead for BEL.
HCL Tech
1,06,731
757
1,000
32.2
Stock is trading at attractive valuations & factors all bad news.
Strong visibility for a robust 20% earnings trajectory, coupled
HDFC Bank
3,13,518
1,238
1,350
9.0
with high quality of earnings on account of high quality retail
business and strategic focus on highly rated corporates.
Back on the growth trend, expect a long term growth of 14% to
Infosys
2,34,805
1,022
1,370
34.0
be a US$20bn in FY2020.
Strong market positioning within the domestic AC markets to
Voltas
12,923
391
407
4.2
continue, EMP business set to revive
Source: Company, Angel Research
Mid Cap
Market Cap
CMP
Target
Upside
Company
Rationale
(` Cr)
(`)
(`)
(%)
Among the top 4 players in the consumer durables segment.
Bajaj Electricals
2,629
260
277
6.5
Improved profitability backed by turn around in E&P segment.
Strong order book lends earnings visibility.
Favourable outlook for the AC industry to augur well for
Cooling products business which is out pacing the market
Blue Star
4,719
495
527
6.5
growth. EMPPAC division's profitability to improve once
operating environment turns around.
Strong loan growth backed by diversified loan portfolio and
Equitas Holdings
5,950
177
235
32.5
adequate CAR. ROE & ROA likely to remain decent as risk of
dilution remains low. Attractive valuations considering growth.
Expectations of above average monsoon augurs well for
Goodyear India
1,261
547
631
15.4
Goodyear India as it derives ~50% of its turnover from farm
tyre segment.
Commencement of new projects, downtrend in the interest rate
IL&FS Transport
2,339
71
93
30.8
cycle, to lead to stock re-rating
Economic recovery to have favourable impact on advertising &
Jagran Prakashan
6,202
190
205
8.1
circulation revenue growth. Further, the acquisition of a radio business
(Radio City) would also boost the company`s revenue growth.
Speedier execution and speedier sales, strong revenue visibility
Mahindra Lifespace
1,763
430
522
21.5
in short-to-long run, attractive valuations
Massive capacity expansion along with rail advantage at ICD as
Navkar Corporation
2,864
201
265
32.0
well CFS augurs well for the company
Earnings boost on back of stable material prices and favourable
Radico Khaitan
1,284
97
125
29.5
pricing environment. Valuation discount to peers provides
additional comfort
Strong brands and distribution network would boost growth
Siyaram Silk Mills
1,209
1,290
1,347
4.5
going ahead. Stock currently trades at an inexpensive valuation.
Market leadership in Hindi news genre and no. 2 viewership
TV Today Network
1,790
300
363
21.0
ranking in English news genre, exit from the radio business, and
anticipated growth in ad spends by corporates to benefit the stock.
Source: Company, Angel Research
Market Outlook
August 30, 2016
Key Upcoming Events
Result Calendar
Date
Company
Sep 1, 2016
BPCL
Sep 5, 2016
Petronet LNG
Sep 7, 2016
BHEL
Sep 8, 2016
SAIL
Source: Bloomberg, Angel Research
Global economic events release calendar
Date
Time
Country
Event Description
Unit
Period
Bloomberg Data
Last Reported Estimated
Aug 30, 2016 2:30PM Euro Zone
Euro-Zone Consumer Confidence
Value
Aug F
(8.50)
(8.50)
7:30PM US
Consumer Confidence
S.A./ 1985=100
Aug
97.30
97.00
Aug 31, 2016 6:00PM US
Initial Jobless claims
Thousands
Aug 27
261.00
265.00
Sep 1, 2016
1:25PM Germany
Unemployment change (000's)
Thousands
Aug
(7.00)
(4.00)
1:25PM Germany
PMI Manufacturing
Value
Aug F
53.60
53.60
6:00PM US
Change in Nonfarm payrolls
Thousands
Aug
255.00
180.00
2:00PM UK
PMI Manufacturing
Value
Aug
48.20
49.00
Sep 2, 2016
6:30AM China
PMI Manufacturing
Value
Aug
49.90
49.80
6:00PM US
Unnemployment rate
%
Aug
4.90
4.80
Sep 5, 2016
1:25PM Germany
PMI Services
Value
Aug F
53.30
--
Sep 6, 2016
2:30PM Euro Zone
Euro-Zone GDP s.a. (QoQ)
% Change
2Q F
0.30
--
Sep 7, 2016
2:00PM UK
Industrial Production (YoY)
% Change
Jul
1.60
--
Sep 8, 2016
China
Exports YoY%
% Change
Aug
(4.40)
--
5:15PM Euro Zone
ECB announces interest rates
%
Sep 8
--
--
Sep 9, 2016
India
Imports YoY%
% Change
Aug
(19.03)
--
India
Exports YoY%
% Change
Aug
(6.84)
--
7:00AM China
Consumer Price Index (YoY)
% Change
Aug
1.80
--
Sep 12, 2016 2:00PM UK
CPI (YoY)
% Change
Aug
0.60
--
Sep 13, 2016 5:30PM India
Industrial Production YoY
% Change
Jul
2.10
--
7:30AM China
Industrial Production (YoY)
% Change
Aug
6.00
--
Sep 14, 2016 2:00PM UK
Jobless claims change
% Change
Aug
(8.60)
--
12:00PM India
Monthly Wholesale Prices YoY%
% Change
Aug
3.55
--
Sep 15, 2016 2:30PM Euro Zone
Euro-Zone CPI (YoY)
%
Aug F
0.20
--
6:45PM US
Industrial Production
%
Aug
0.74
--
US
Producer Price Index (mom)
% Change
Aug
(0.50)
--
4:30PM UK
BOE Announces rates
% Ratio
Sep 15
0.25
--
Source: Bloomberg, Angel Research
Market Outlook
August 30, 2016
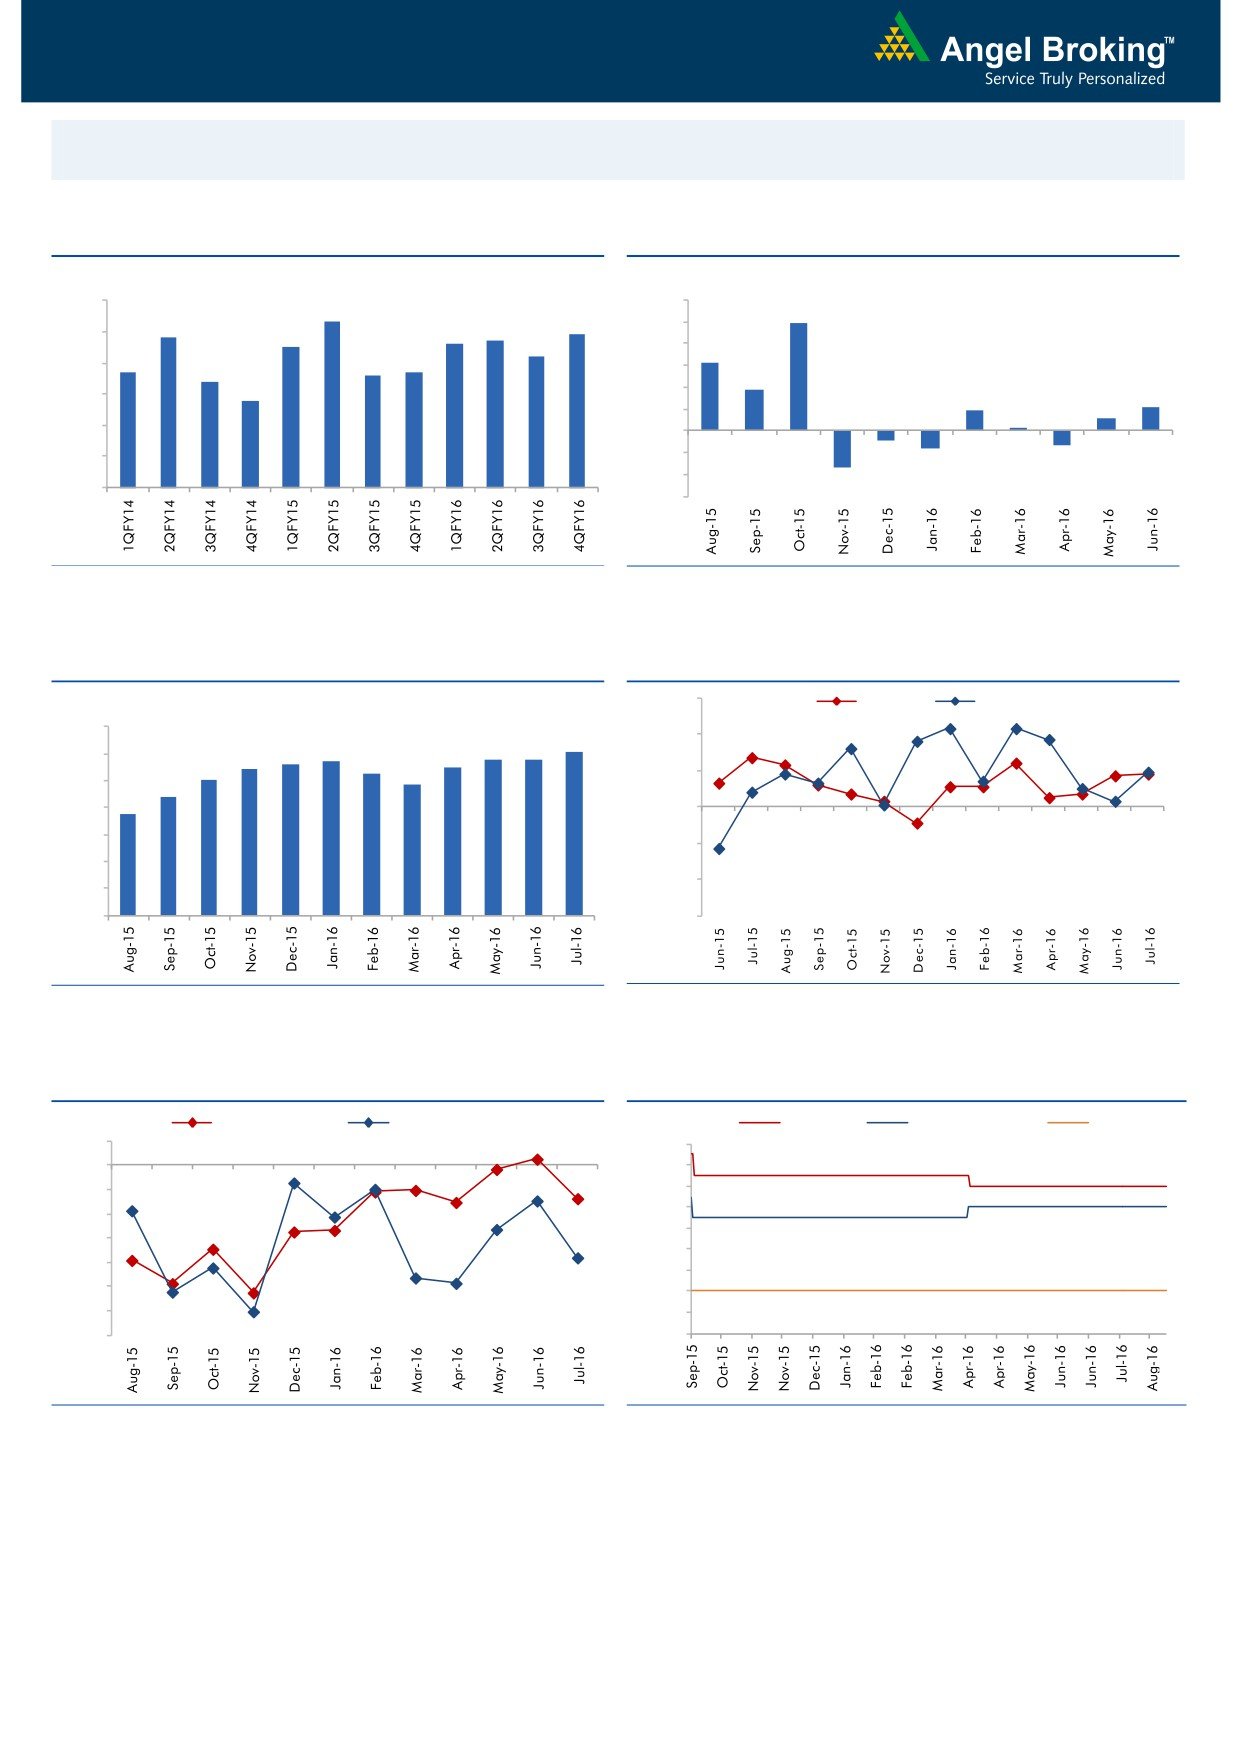
Macro watch
Exhibit 1: Quarterly GDP trends
Exhibit 2: IIP trends
(%)
(%)
9.0
8.3
12.0
9.9
7.8
7.7
7.9
10.0
8.0
7.5
7.6
7.2
8.0
6.3
6.7
6.6
6.7
7.0
6.4
6.0
3.7
5.8
4.0
2.1
6.0
1.9
1.1
2.0
0.3
5.0
-
4.0
(2.0)
(0.9)
(1.3)
(1.6)
(4.0)
3.0
(3.4)
(6.0)
Source: CSO, Angel Research
Source: MOSPI, Angel Research
Exhibit 3: Monthly CPI inflation trends
Exhibit 4: Manufacturing and services PMI
56.0
Mfg. PMI
Services PMI
(%)
7.0
6.1
54.0
5.6
5.7
5.8
5.8
5.4
5.5
6.0
5.3
5.0
4.8
52.0
5.0
4.4
3.7
4.0
50.0
3.0
48.0
2.0
46.0
1.0
-
44.0
Source: MOSPI, Angel Research
Source: Market, Angel Research; Note: Level above 50 indicates expansion
Exhibit 5: Exports and imports growth trends
Exhibit 6: Key policy rates
(%)
Exports yoy growth
Imports yoy growth
(%)
Repo rate
Reverse Repo rate
CRR
5.0
7.50
0.0
7.00
(5.0)
6.50
6.00
(10.0)
5.50
(15.0)
5.00
(20.0)
4.50
(25.0)
4.00
(30.0)
3.50
(35.0)
3.00
Source: Bloomberg, Angel Research
Source: RBI, Angel Research
Market Outlook
August 30, 2016
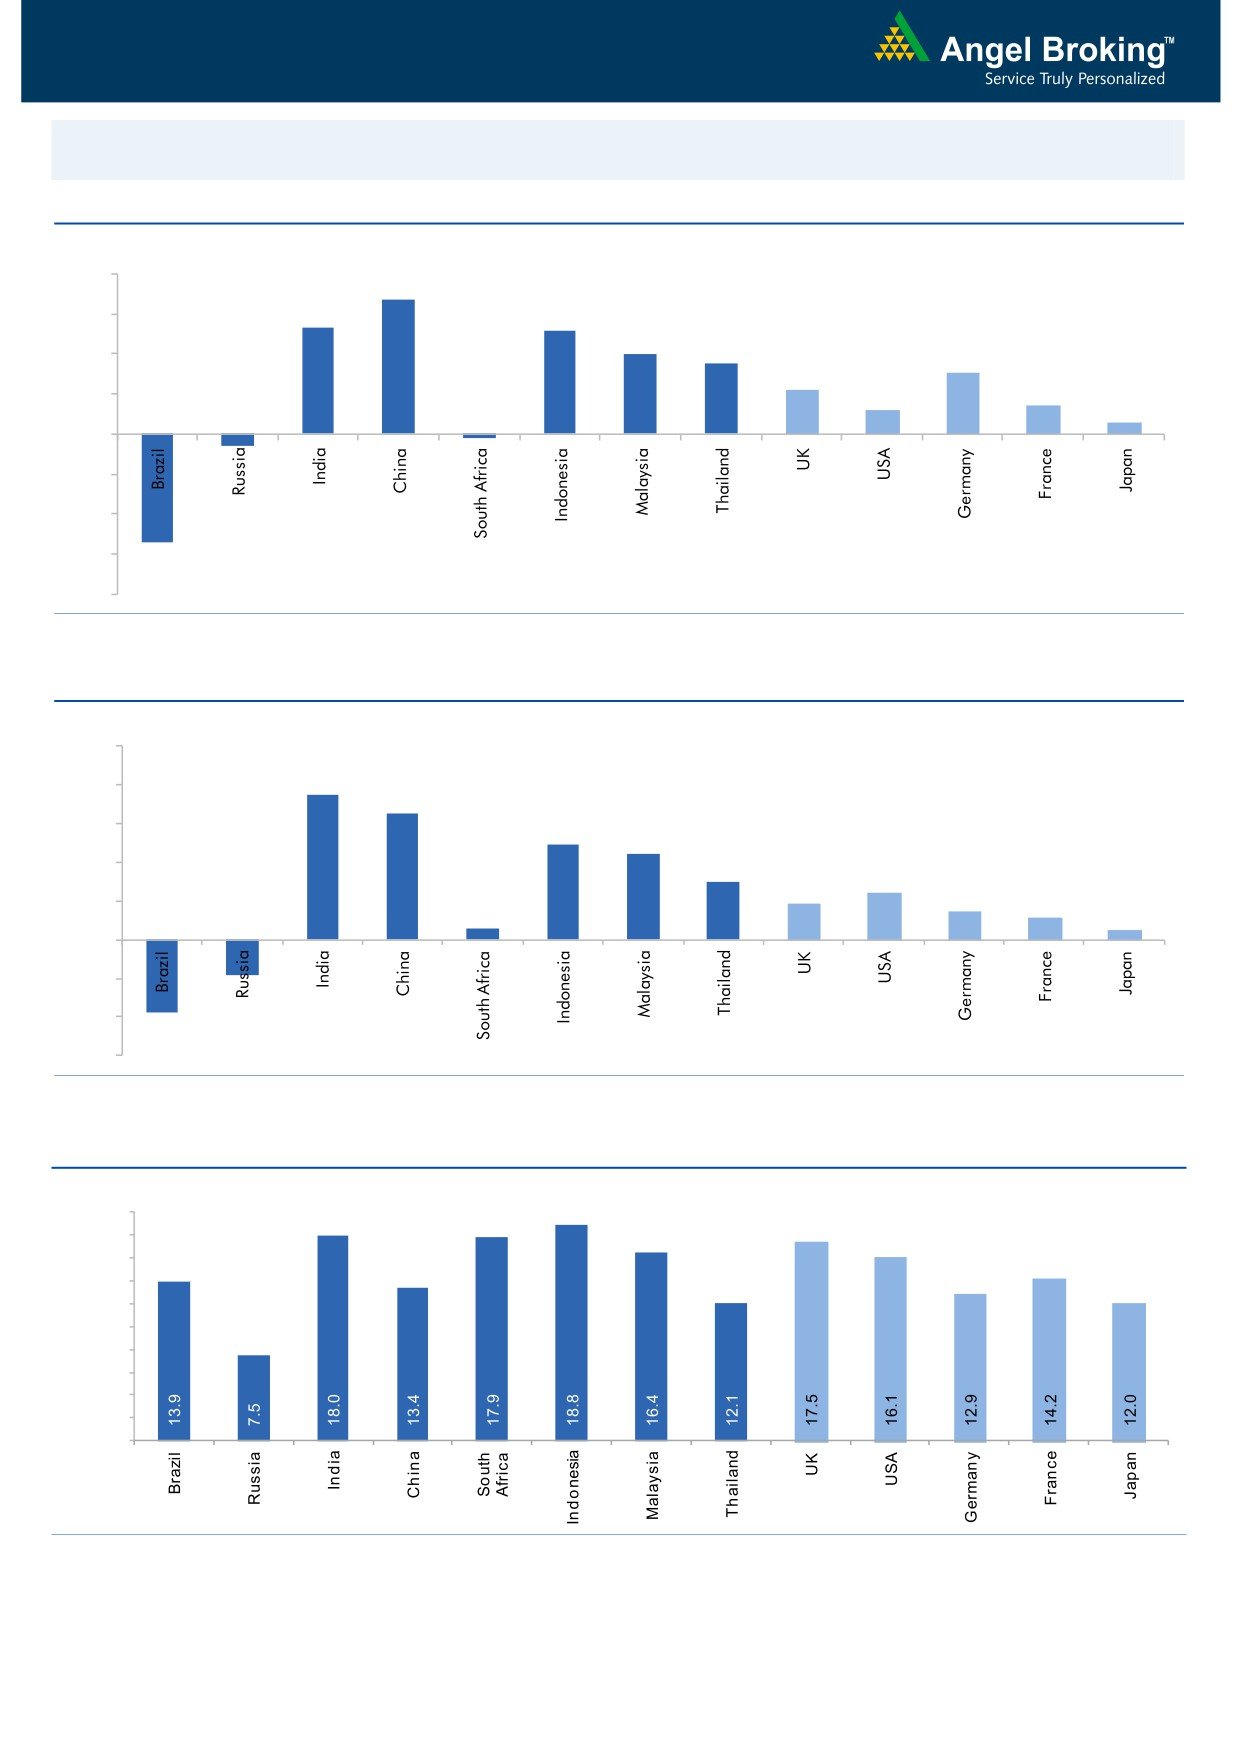
Global watch
Exhibit 1: Latest quarterly GDP Growth (%, yoy) across select developing and developed countries
(%)
8.0
6.7
6.0
5.3
5.2
4.0
3.5
4.0
3.1
2.2
2.0
1.2
1.4
0.6
-
(2.0)
(0.6)
(4.0)
(6.0)
(5.4)
(0.2)
(8.0)
Source: Bloomberg, Angel Research
Exhibit 2: 2016 GDP Growth projection by IMF (%, yoy) across select developing and developed countries
(%)
10.0
7.5
8.0
6.5
6.0
4.9
4.4
4.0
3.0
2.4
1.9
1.5
2.0
1.1
0.6
0.5
(3.8)
(1.8)
-
(2.0)
(4.0)
(6.0)
Source: IMF, Angel Research
Exhibit 3: One year forward P-E ratio across select developing and developed countries
(x)
20.0
18.0
16.0
14.0
12.0
10.0
8.0
6.0
4.0
2.0
-
Source: IMF, Angel Research
Market Outlook
August 30, 2016
Exhibit 4: Relative performance of indices across globe
Returns (%)
Country
Name of index
Closing price
1M
3M
1YR
Brazil
Bovespa
58,610
3.4
20.9
32.2
Russia
Micex
1,987
1.7
2.6
17.2
India
Nifty
8,607
(0.1)
5.5
2.8
China
Shanghai Composite
3,070
3.1
8.9
(16.2)
South Africa
Top 40
46,912
0.3
(1.9)
9.5
Mexico
Mexbol
47,599
1.6
4.7
8.9
Indonesia
LQ45
924
1.0
14.4
22.0
Malaysia
KLCI
1,682
1.4
3.1
6.6
Thailand
SET 50
983
2.3
10.2
9.9
USA
Dow Jones
18,503
0.3
3.5
11.9
UK
FTSE
6,838
1.3
9.0
12.9
Japan
Nikkei
16,737
0.4
(0.6)
(18.6)
Germany
DAX
10,544
2.6
2.7
4.9
France
CAC
4,424
0.1
(1.8)
(2.8)
Source: Bloomberg, Angel Research
Stock Watch
August 30, 2016
Company Name
Reco
CMP
Target
Mkt Cap
Sales ( Čcr )
OPM(%)
EPS (Č)
PER(x)
P/BV(x)
RoE(%)
EV/Sales(x)
(Č)
Price ( Č)
( Č cr )
FY17E FY18E
FY17E
FY18E
FY17E
FY18E
FY17E
FY18E
FY17E
FY18E
FY17E
FY18E
FY17E
FY18E
Agri / Agri Chemical
Rallis
Neutral
227
-
4,409
1,937
2,164
13.3
14.3
9.0
11.0
25.2
20.6
4.4
3.8
18.4
19.8
2.3
2.1
United Phosphorus
Accumulate
637
684
27,300
15,176
17,604
18.5
18.5
37.4
44.6
17.0
14.3
3.3
2.8
21.4
21.2
1.9
1.6
Auto & Auto Ancillary
Ashok Leyland
Buy
88
111
25,001
22,407
26,022
10.6
10.6
5.2
6.4
16.8
13.7
3.8
3.2
23.6
24.7
1.2
1.0
Bajaj Auto
Neutral
2,884
-
83,462
25,093
27,891
19.5
19.2
143.9
162.5
20.0
17.8
5.6
4.8
30.3
29.4
3.0
2.7
Bharat Forge
Neutral
854
-
19,879
7,726
8,713
20.5
21.2
35.3
42.7
24.2
20.0
4.5
4.0
18.9
20.1
2.6
2.3
Eicher Motors
Neutral
22,308
-
60,591
16,583
20,447
17.5
18.0
598.0
745.2
37.3
29.9
12.8
9.7
41.2
38.3
3.4
2.7
Gabriel India
Neutral
116
-
1,659
1,544
1,715
9.0
9.3
5.4
6.3
21.4
18.3
4.0
3.6
18.9
19.5
1.1
0.9
Hero Motocorp
Neutral
3,406
-
68,009
31,253
35,198
15.3
15.0
172.3
192.1
19.8
17.7
7.2
6.2
38.9
37.0
2.0
1.7
Jamna Auto Industries Neutral
225
-
1,798
1,486
1,620
9.8
9.9
15.0
17.2
15.0
13.1
3.3
2.8
21.8
21.3
1.2
1.1
L G Balakrishnan & Bros Neutral
466
-
731
1,302
1,432
11.6
11.9
43.7
53.0
10.7
8.8
1.5
1.4
13.8
14.2
0.6
0.6
Mahindra and Mahindra Neutral
1,422
-
88,326
46,534
53,077
11.6
11.7
67.3
78.1
21.1
18.2
3.4
3.0
15.4
15.8
1.9
1.6
Maruti
Neutral
4,929
-
148,909
69,186
82,217
14.7
14.4
198.5
241.4
24.8
20.4
4.8
3.9
20.2
20.0
1.9
1.5
Minda Industries
Neutral
1,242
-
1,970
2,728
3,042
9.0
9.1
68.2
86.2
18.2
14.4
4.1
3.3
23.8
24.3
0.8
0.7
Motherson Sumi
Neutral
324
-
42,903
45,896
53,687
7.8
8.3
13.0
16.1
24.9
20.1
8.0
6.4
34.7
35.4
1.0
0.8
Rane Brake Lining
Neutral
658
-
521
511
562
11.3
11.5
28.1
30.9
23.4
21.3
3.6
3.3
15.3
15.0
1.2
1.1
Setco Automotive
Neutral
45
-
599
741
837
13.0
13.0
15.2
17.0
3.0
2.6
0.5
0.4
15.8
16.3
1.2
1.1
Tata Motors
Neutral
525
-
151,492
300,209
338,549
8.9
8.4
42.7
54.3
12.3
9.7
2.0
1.7
15.6
17.2
0.6
0.5
TVS Motor
Accumulate
312
330
14,808
13,390
15,948
6.9
7.1
12.8
16.5
24.4
18.8
6.1
4.8
26.3
27.2
1.1
0.9
Amara Raja Batteries
Buy
920
1,076
15,718
5,717
6,733
18.7
18.9
38.4
48.9
24.0
18.8
6.0
4.9
25.3
24.8
2.5
2.0
Exide Industries
Neutral
179
-
15,207
7,439
8,307
15.0
15.0
8.1
9.3
22.1
19.2
3.1
2.8
14.3
16.7
1.6
1.5
Apollo Tyres
Accumulate
184
183
9,374
12,877
14,504
14.3
13.9
21.4
23.0
8.6
8.0
1.3
1.2
16.4
15.2
0.9
0.8
Ceat
Buy
899
1,119
3,635
7,524
8,624
13.0
12.7
131.1
144.3
6.9
6.2
1.3
1.1
19.8
18.6
0.5
0.5
JK Tyres
Neutral
130
-
2,949
7,455
8,056
15.0
15.0
21.8
24.5
6.0
5.3
1.3
1.0
22.8
21.3
0.5
0.4
Swaraj Engines
Neutral
1,116
-
1,386
660
810
15.2
16.4
54.5
72.8
20.5
15.3
6.4
5.8
31.5
39.2
1.9
1.6
Subros
Neutral
101
-
608
1,488
1,681
11.7
11.9
6.4
7.2
15.8
14.1
1.7
1.5
10.8
11.4
0.6
0.5
Indag Rubber
Neutral
177
-
465
286
326
19.8
16.8
11.7
13.3
15.1
13.3
2.6
2.4
17.8
17.1
1.2
1.1
Capital Goods
ACE
Neutral
43
-
426
709
814
4.1
4.6
1.4
2.1
30.8
20.5
1.3
1.2
4.4
6.0
0.8
0.7
BEML
Accumulate
1,059
1,157
4,410
3,451
4,055
6.3
9.2
31.4
57.9
33.7
18.3
2.0
1.8
6.3
10.9
1.4
1.2
Bharat Electronics
Buy
1,215
1,414
29,158
8,137
9,169
16.8
17.2
58.7
62.5
20.7
19.4
3.2
2.9
44.6
46.3
2.5
2.3
Stock Watch
August 30, 2016
Company Name
Reco
CMP
Target
Mkt Cap
Sales ( Čcr )
OPM(%)
EPS (Č)
PER(x)
P/BV(x)
RoE(%)
EV/Sales(x)
(Č)
Price ( Č)
( Č cr )
FY17E
FY18E
FY17E
FY18E
FY17E
FY18E
FY17E
FY18E
FY17E
FY18E
FY17E
FY18E
FY17E
FY18E
Capital Goods
Voltas
Accumulate
391
407
12,923
6,511
7,514
7.9
8.7
12.9
16.3
30.3
24.0
5.5
4.8
16.7
18.5
1.7
1.4
BGR Energy
Neutral
114
-
820
16,567
33,848
6.0
5.6
7.8
5.9
14.6
19.3
0.8
0.8
4.7
4.2
0.2
0.1
BHEL
Neutral
141
-
34,438
28,797
34,742
-
2.8
2.3
6.9
61.2
20.4
1.0
1.0
1.3
4.8
0.9
0.6
Blue Star
Accumulate
495
527
4,719
4,351
5,024
6.4
7.1
17.2
20.6
28.8
24.0
18.8
15.6
23.1
24.1
1.1
1.0
Crompton Greaves
Neutral
80
-
5,039
5,777
6,120
5.9
7.0
3.3
4.5
24.4
17.9
1.1
1.0
4.4
5.9
0.9
0.7
Greaves Cotton
Neutral
136
-
3,320
1,755
1,881
16.8
16.9
7.8
8.5
17.4
16.0
3.5
3.2
20.6
20.9
1.6
1.4
Inox Wind
Buy
185
286
4,094
5,605
6,267
15.7
16.4
24.8
30.0
7.4
6.2
2.1
1.5
25.9
24.4
0.8
0.7
KEC International
Neutral
136
-
3,499
9,294
10,186
7.9
8.1
9.9
11.9
13.8
11.4
2.0
1.8
15.6
16.3
0.6
0.6
Thermax
Neutral
820
-
9,771
5,421
5,940
7.3
7.3
25.7
30.2
31.9
27.2
3.9
3.5
12.2
13.1
1.7
1.6
VATech Wabag
Buy
555
681
3,027
3,136
3,845
8.9
9.1
26.0
35.9
21.4
15.5
2.7
2.3
13.4
15.9
0.9
0.7
Cement
ACC
Neutral
1,635
-
30,711
11,225
13,172
13.2
16.9
44.5
75.5
36.8
21.7
3.5
3.2
11.2
14.2
2.8
2.4
Ambuja Cements
Neutral
264
-
52,451
9,350
10,979
18.2
22.5
5.8
9.5
45.5
27.8
3.8
3.4
10.2
12.5
5.6
4.8
India Cements
Neutral
143
-
4,402
4,364
4,997
18.5
19.2
7.9
11.3
18.1
12.7
1.3
1.3
8.0
8.5
1.8
1.5
JK Cement
Neutral
791
-
5,528
4,398
5,173
15.5
17.5
31.2
55.5
25.3
14.2
3.0
2.6
12.0
15.5
1.8
1.5
J K Lakshmi Cement
Neutral
453
-
5,326
2,913
3,412
14.5
19.5
7.5
22.5
60.4
20.1
3.7
3.1
12.5
18.0
2.4
2.0
Orient Cement
Neutral
182
-
3,727
2,114
2,558
18.5
20.5
8.1
11.3
22.5
16.1
3.3
2.8
9.0
14.0
2.4
1.9
UltraTech Cement
Neutral
3,788
-
103,946
25,768
30,385
21.0
23.5
111.0
160.0
34.1
23.7
4.4
3.8
13.5
15.8
4.1
3.4
Construction
ITNL
Buy
71
93
2,339
8,946
10,017
31.0
31.6
8.1
9.1
8.8
7.8
0.3
0.3
4.2
5.0
3.6
3.3
KNR Constructions
Accumulate
699
802
1,966
1,385
1,673
14.7
14.0
41.2
48.5
17.0
14.4
3.2
2.7
14.9
15.2
1.5
1.3
Larsen & Toubro
Buy
1,456
1,700
135,719
67,665
77,249
10.7
11.5
57.3
71.2
25.4
20.5
2.3
2.2
12.6
14.3
2.2
1.9
Gujarat Pipavav Port
Neutral
176
-
8,484
705
788
52.2
51.7
5.0
5.6
35.1
31.3
3.5
3.1
11.2
11.2
11.4
9.7
MBL Infrastructures
Buy
105
285
437
2,797
3,405
14.7
15.4
21.0
34.8
5.0
3.0
0.5
0.5
11.0
16.2
0.8
0.8
Nagarjuna Const.
Neutral
82
-
4,573
8,842
9,775
9.1
8.8
5.3
6.4
15.5
12.9
1.2
1.1
8.2
9.1
0.7
0.6
PNC Infratech
Accumulate
120
129
3,069
2,350
2,904
13.4
13.7
48.0
42.0
2.5
2.9
0.5
0.4
16.8
13.2
1.4
1.2
Simplex Infra
Neutral
295
-
1,457
6,829
7,954
10.5
10.5
31.4
37.4
9.4
7.9
1.0
0.9
9.9
13.4
0.6
0.5
Power Mech Projects
Neutral
464
-
682
1,801
2,219
12.7
14.6
72.1
113.9
6.4
4.1
1.2
1.0
16.8
11.9
0.4
0.3
Sadbhav Engineering
Neutral
293
-
5,026
3,598
4,140
10.3
10.6
9.0
11.9
32.6
24.6
3.4
3.0
9.9
11.9
1.6
1.4
NBCC
Neutral
237
-
14,205
7,428
9,549
7.9
8.6
8.2
11.0
28.9
21.5
1.4
1.1
28.2
28.7
1.7
1.2
MEP Infra
Neutral
44
-
717
1,877
1,943
30.6
29.8
3.0
4.2
14.7
10.5
7.1
4.8
0.6
0.6
1.8
1.6
Stock Watch
August 30, 2016
Company Name
Reco
CMP
Target
Mkt Cap
Sales ( Čcr )
OPM(%)
EPS (Č)
PER(x)
P/BV(x)
RoE(%)
EV/Sales(x)
(Č)
Price ( Č)
( Č cr )
FY17E
FY18E
FY17E
FY18E
FY17E
FY18E
FY17E
FY18E
FY17E
FY18E
FY17E
FY18E
FY17E
FY18E
Construction
SIPL
Neutral
97
-
3,399
1,036
1,252
65.5
66.2
(8.4)
(5.6)
3.6
4.1
(22.8)
(15.9)
11.5
9.6
Engineers India
Neutral
265
-
8,919
1,725
1,935
16.0
19.1
11.4
13.9
23.2
19.0
3.2
3.1
13.4
15.3
4.0
3.6
Financials
Axis Bank
Neutral
589
-
140,532
58,081
66,459
3.5
3.5
32.4
44.6
18.2
13.2
2.4
2.1
13.6
16.5
-
-
Bank of Baroda
Neutral
160
-
36,936
19,980
23,178
1.8
1.8
11.5
17.3
13.9
9.3
1.6
1.3
8.3
10.1
-
-
Canara Bank
Neutral
273
-
14,810
15,225
16,836
1.8
1.8
14.5
28.0
18.8
9.7
1.3
1.1
5.8
8.5
-
-
Dewan Housing Finance Neutral
280
-
8,182
2,225
2,688
2.9
2.9
29.7
34.6
9.4
8.1
1.5
1.3
16.1
16.8
-
-
Equitas Holdings
Buy
177
235
5,950
939
1,281
11.7
11.5
5.8
8.2
30.6
21.6
2.6
2.4
10.9
11.5
-
-
Federal Bank
Neutral
67
-
11,520
9,353
10,623
2.9
2.9
4.4
5.8
15.2
11.6
1.5
1.3
9.5
11.0
-
-
HDFC
Neutral
1,375
-
217,399
11,475
13,450
3.4
3.4
45.3
52.5
30.4
26.2
5.9
5.2
20.2
20.5
-
-
HDFC Bank
Accumulate
1,238
1,350
313,518
46,097
55,433
4.5
4.5
58.4
68.0
21.2
18.2
3.7
3.1
18.8
18.6
-
-
ICICI Bank
Neutral
250
-
145,656
39,029
45,903
3.3
3.3
16.7
16.3
15.0
15.4
1.9
1.7
10.1
12.4
-
-
LIC Housing Finance
Neutral
570
-
28,766
3,712
4,293
2.6
2.5
39.0
46.0
14.6
12.4
2.7
2.3
19.9
20.1
-
-
Punjab Natl.Bank
Neutral
123
-
24,162
23,532
23,595
2.3
2.4
6.8
12.6
18.1
9.8
2.8
2.0
3.3
6.5
-
-
South Ind.Bank
Neutral
22
-
2,998
6,435
7,578
2.5
2.5
2.7
3.1
8.2
7.2
1.1
0.9
10.1
11.2
-
-
St Bk of India
Neutral
249
-
193,099
88,650
98,335
2.6
2.6
13.5
18.8
18.4
13.2
1.8
1.5
7.0
8.5
-
-
Union Bank
Neutral
134
-
9,229
13,450
14,925
2.3
2.3
25.5
34.5
5.3
3.9
0.8
0.7
7.5
10.2
-
-
Yes Bank
Neutral
1,337
-
56,300
8,978
11,281
3.3
3.4
74.0
90.0
18.1
14.9
3.4
2.9
17.0
17.2
-
-
FMCG
Asian Paints
Neutral
1,111
-
106,586
17,128
18,978
16.8
16.4
19.1
20.7
58.2
53.7
20.2
19.1
34.8
35.5
6.1
5.5
Britannia
Neutral
3,408
-
40,890
9,795
11,040
14.6
14.9
80.3
94.0
42.4
36.3
17.5
13.5
41.2
-
4.1
3.6
Colgate
Neutral
937
-
25,481
4,605
5,149
23.4
23.4
23.8
26.9
39.4
34.8
21.8
17.0
64.8
66.8
5.5
4.9
Dabur India
Neutral
288
-
50,707
8,315
9,405
19.8
20.7
8.1
9.2
35.6
31.3
9.9
8.2
31.6
31.0
5.8
5.1
GlaxoSmith Con*
Neutral
6,296
-
26,479
4,350
4,823
21.2
21.4
179.2
196.5
35.1
32.1
9.3
7.9
27.1
26.8
5.4
4.8
Godrej Consumer
Neutral
1,537
-
52,354
10,235
11,428
18.4
18.6
41.1
44.2
37.4
34.8
8.3
7.0
24.9
24.8
5.2
4.6
HUL
Neutral
905
-
195,832
35,252
38,495
17.6
17.4
20.4
21.9
44.3
41.3
36.4
31.9
82.2
77.3
5.4
4.9
ITC
Accumulate
253
283
305,210
40,059
44,439
39.0
39.2
9.1
10.1
27.8
25.0
7.6
6.6
27.2
26.5
7.1
6.4
Marico
Neutral
285
-
36,731
6,430
7,349
18.8
19.5
6.4
7.7
44.5
37.0
13.4
11.3
33.2
32.5
5.5
4.8
Nestle*
Neutral
6,778
-
65,353
10,073
11,807
20.7
21.5
124.8
154.2
54.3
44.0
22.3
20.1
34.8
36.7
6.4
5.4
Tata Global
Neutral
139
-
8,773
8,675
9,088
9.8
9.8
7.4
8.2
18.8
17.0
2.1
2.0
7.9
8.1
0.9
0.9
Procter & Gamble
Accumulate
6,709
7,369
21,778
2,939
3,342
23.2
23.0
146.2
163.7
45.9
41.0
102.7
98.5
25.3
23.5
7.0
6.1
Hygiene
Stock Watch
August 30, 2016
Company Name
Reco
CMP
Target
Mkt Cap
Sales ( Čcr )
OPM(%)
EPS (Č)
PER(x)
P/BV(x)
RoE(%)
EV/Sales(x)
(Č)
Price ( Č)
( Č cr )
FY17E FY18E
FY17E
FY18E
FY17E
FY18E
FY17E
FY18E
FY17E
FY18E
FY17E
FY18E
FY17E
FY18E
IT
HCL Tech^
Buy
757
1,000
106,731
49,242
57,168
20.5
20.5
55.7
64.1
13.6
11.8
2.8
2.1
20.3
17.9
2.2
1.7
Infosys
Buy
1,022
1,370
234,805
69,934
79,025
27.5
27.5
64.8
72.0
15.8
14.2
3.5
3.2
22.0
22.3
2.9
2.5
TCS
Buy
2,502
3,004
492,922
121,684
136,286
27.3
27.3
135.0
150.1
18.5
16.7
6.2
5.7
33.2
33.9
3.9
3.4
Tech Mahindra
Buy
450
700
43,647
30,347
33,685
17.0
17.0
37.5
41.3
12.0
10.9
2.6
2.3
21.8
20.7
1.2
1.0
Wipro
Buy
479
680
118,236
51,631
55,822
21.7
17.9
35.9
36.9
13.3
13.0
2.8
2.6
19.0
18.1
2.1
1.9
Media
D B Corp
Neutral
408
-
7,506
2,297
2,590
27.4
28.2
21.0
23.4
19.5
17.5
4.5
3.9
23.7
23.1
3.1
2.7
HT Media
Neutral
79
-
1,828
2,693
2,991
12.6
12.9
7.9
9.0
9.9
8.7
0.8
0.8
7.8
8.3
0.3
0.1
Jagran Prakashan
Accumulate
190
205
6,202
2,355
2,635
28.0
28.0
9.9
10.8
19.2
17.6
3.8
3.3
21.7
21.7
2.6
2.3
Sun TV Network
Neutral
467
-
18,394
2,850
3,265
70.1
71.0
26.2
30.4
17.8
15.4
4.6
4.0
24.3
25.6
6.1
5.2
Hindustan Media
Neutral
286
-
2,098
1,016
1,138
24.3
25.2
27.3
30.1
10.5
9.5
2.0
1.8
16.2
15.8
1.3
1.2
Ventures
TV Today Network
Buy
300
363
1,790
637
743
27.5
27.5
18.4
21.4
16.3
14.0
2.8
2.4
17.4
17.2
2.4
2.0
Metals & Mining
Coal India
Neutral
334
-
210,872
84,638
94,297
21.4
22.3
24.5
27.1
13.6
12.3
5.7
5.4
42.6
46.0
2.0
1.8
Hind. Zinc
Neutral
227
-
96,105
14,252
18,465
55.9
48.3
15.8
21.5
14.4
10.6
2.3
2.1
17.0
20.7
6.7
5.1
Hindalco
Neutral
158
-
32,699
107,899
112,095
7.4
8.2
9.2
13.0
17.2
12.2
0.8
0.8
4.8
6.6
0.8
0.8
JSW Steel
Neutral
1,770
-
42,781
53,201
58,779
16.1
16.2
130.6
153.7
13.6
11.5
1.8
1.6
14.0
14.4
1.6
1.3
NMDC
Neutral
108
-
42,898
6,643
7,284
44.4
47.7
7.1
7.7
15.2
14.1
1.3
1.3
8.8
9.2
4.2
3.8
SAIL
Neutral
48
-
19,928
47,528
53,738
(0.7)
2.1
(1.9)
2.6
18.6
0.5
0.5
(1.6)
3.9
1.3
1.2
Vedanta
Neutral
173
-
51,393
71,744
81,944
19.2
21.7
13.4
20.1
12.9
8.6
1.1
1.0
8.4
11.3
1.1
0.8
Tata Steel
Neutral
373
-
36,236
121,374
121,856
7.2
8.4
18.6
34.3
20.1
10.9
1.3
1.2
6.1
10.1
0.9
0.9
Oil & Gas
Cairn India
Neutral
203
-
38,032
9,127
10,632
4.3
20.6
8.8
11.7
23.1
17.3
0.7
0.7
3.3
4.2
5.6
4.6
GAIL
Neutral
378
-
47,929
56,220
65,198
9.3
10.1
27.1
33.3
13.9
11.4
1.3
1.2
9.3
10.7
1.0
0.9
ONGC
Neutral
237
-
202,979
137,222
152,563
15.0
21.8
19.5
24.1
12.2
9.8
1.0
1.0
8.5
10.1
1.8
1.6
Indian Oil Corp
Neutral
572
-
138,818
373,359
428,656
5.9
5.5
54.0
59.3
10.6
9.6
1.6
1.5
16.0
15.6
0.5
0.4
Reliance Industries
Neutral
1,057
-
342,726
301,963
358,039
12.1
12.6
87.7
101.7
12.1
10.4
1.2
1.1
10.7
11.3
1.6
1.3
Pharmaceuticals
Alembic Pharma
Neutral
631
-
11,900
3,483
4,083
20.2
21.4
24.3
30.4
26.0
20.8
5.9
4.7
25.5
25.3
3.4
2.8
Aurobindo Pharma
Accumulate
785
877
45,942
15,720
18,078
23.7
23.7
41.4
47.3
19.0
16.6
4.9
3.9
29.6
26.1
3.2
2.7
Sanofi India*
Neutral
4,302
-
9,908
2,357
2,692
17.3
17.3
153.5
169.2
28.0
25.4
4.8
3.8
25.8
28.4
3.9
3.2
Cadila Healthcare
Neutral
380
-
38,897
11,126
13,148
22.0
22.0
17.1
20.0
22.2
19.0
5.7
4.5
28.8
26.6
3.5
2.9
Cipla
Reduce
567
490
45,578
15,378
18,089
17.4
18.4
21.6
27.2
26.3
20.9
3.4
3.0
13.7
15.2
3.1
2.6
Stock Watch
August 30, 2016
Company Name
Reco
CMP
Target
Mkt Cap
Sales ( Čcr )
OPM(%)
EPS (Č)
PER(x)
P/BV(x)
RoE(%)
EV/Sales(x)
(Č)
Price ( Č)
( Č cr )
FY17E FY18E
FY17E
FY18E
FY17E
FY18E
FY17E
FY18E
FY17E
FY18E
FY17E
FY18E
FY17E
FY18E
Pharmaceuticals
Dr Reddy's
Neutral
3,048
-
51,987
16,043
18,119
23.1
24.7
126.0
157.8
24.2
19.3
3.6
3.1
15.7
17.1
3.2
2.8
Dishman Pharma
Sell
182
45
2,935
1,718
1,890
22.7
22.8
9.5
11.3
19.1
16.1
1.9
1.7
10.1
10.9
2.1
1.8
GSK Pharma*
Neutral
2,980
-
25,243
3,528
3,811
16.6
18.8
51.8
59.4
57.5
50.2
15.4
15.3
26.3
30.6
7.0
6.5
Indoco Remedies
Sell
315
225
2,899
1,112
1,289
18.2
18.2
13.2
15.6
23.8
20.2
4.2
3.6
19.2
19.2
2.8
2.4
Ipca labs
Accumulate
548
613
6,915
3,303
3,799
15.3
15.3
17.3
19.7
31.7
27.8
2.8
2.5
9.1
9.4
2.2
1.9
Lupin
Buy
1,480
1,809
66,715
15,912
18,644
26.4
26.7
58.1
69.3
25.5
21.4
5.0
4.1
21.4
20.9
4.4
3.6
Sun Pharma
Buy
759
944
182,668
31,129
35,258
30.0
30.9
28.0
32.8
27.1
23.1
4.2
3.5
18.7
18.9
5.5
4.7
Power
Tata Power
Neutral
76
-
20,542
36,916
39,557
17.4
27.1
5.1
6.3
14.9
12.1
1.3
1.2
9.0
10.3
1.6
1.4
NTPC
Neutral
159
-
131,433
86,605
95,545
17.5
20.8
11.8
13.4
13.5
11.9
1.4
1.3
10.5
11.1
2.9
2.8
Power Grid
Neutral
180
-
94,299
25,763
29,762
74.3
73.1
14.8
17.3
12.2
10.4
1.9
1.7
16.9
17.5
8.0
7.6
Real Estate
MLIFE
Buy
430
522
1,763
1,152
1,300
22.7
24.6
29.9
35.8
14.4
12.0
1.1
1.0
7.6
8.6
2.3
1.9
Telecom
Bharti Airtel
Neutral
342
-
136,611
105,086
114,808
34.5
34.7
12.2
16.4
28.0
20.8
1.9
1.8
6.8
8.4
2.2
1.9
Idea Cellular
Neutral
94
-
34,010
40,133
43,731
37.2
37.1
6.4
6.5
14.8
14.5
1.2
1.1
8.2
7.6
1.9
1.6
zOthers
Abbott India
Neutral
4,730
-
10,052
3,153
3,583
14.1
14.4
152.2
182.7
31.1
25.9
152.6
130.3
25.6
26.1
2.9
2.5
Bajaj Electricals
Accumulate
260
277
2,629
5,099
5,805
5.7
5.9
11.4
14.6
22.9
17.9
3.1
2.7
13.4
15.1
0.5
0.4
Finolex Cables
Neutral
430
-
6,583
2,883
3,115
12.0
12.1
14.2
18.6
30.3
23.1
16.1
14.1
15.8
14.6
2.0
1.8
Goodyear India*
Buy
547
631
1,261
1,598
1,704
10.4
10.2
49.4
52.6
11.1
10.4
51.1
44.8
18.2
17.0
0.5
62.2
Hitachi
Neutral
1,508
-
4,101
2,081
2,433
8.8
8.9
33.4
39.9
45.2
37.8
36.4
30.4
22.1
21.4
2.0
1.7
Jyothy Laboratories
Neutral
307
-
5,559
1,440
2,052
11.5
13.0
8.5
10.0
36.1
30.7
8.8
8.1
18.6
19.3
4.0
2.8
Page Industries
Neutral
14,611
-
16,297
2,450
3,124
20.1
17.6
299.0
310.0
48.9
47.1
325.4
248.4
47.1
87.5
6.5
5.2
Relaxo Footwears
Neutral
457
-
5,483
2,085
2,469
9.2
8.2
7.6
8.0
60.4
57.5
23.4
20.0
17.9
18.8
2.7
2.3
Siyaram Silk Mills
Accumulate
1,290
1,347
1,209
1,799
2,040
11.6
11.7
104.9
122.4
12.3
10.5
2.0
1.7
16.4
16.4
0.9
0.8
Styrolution ABS India*
Neutral
574
-
1,010
1,440
1,537
9.2
9.0
40.6
42.6
14.1
13.5
36.1
32.8
12.3
11.6
0.7
0.6
TVS Srichakra
Buy
2,543
2,932
1,947
2,304
2,614
13.7
13.8
231.1
266.6
11.0
9.5
285.7
225.0
33.9
29.3
0.8
0.7
HSIL
Neutral
356
-
2,571
2,384
2,515
15.8
16.3
15.3
19.4
23.3
18.3
23.1
19.9
7.8
9.3
1.3
1.2
Kirloskar Engines India
Neutral
281
-
4,059
2,554
2,800
9.9
10.0
10.5
12.1
26.7
23.2
11.2
10.6
10.7
11.7
1.2
1.1
Ltd
M M Forgings
Neutral
417
-
503
546
608
20.4
20.7
41.3
48.7
10.1
8.6
57.1
50.5
16.6
17.0
0.8
0.7
Banco Products (India)
Neutral
212
-
1,519
1,353
1,471
12.3
12.4
14.5
16.3
14.7
13.0
20.2
18.2
14.5
14.6
1.1
116.8
Competent Automobiles Neutral
175
-
108
1,137
1,256
3.1
2.7
28.0
23.6
6.3
7.4
33.7
30.5
14.3
11.5
0.1
0.1
Stock Watch
August 30, 2016
Company Name
Reco
CMP
Target
Mkt Cap
Sales ( Čcr )
OPM(%)
EPS (Č)
PER(x)
P/BV(x)
RoE(%)
EV/Sales(x)
(Č)
Price ( Č)
( Č cr )
FY17E
FY18E
FY17E
FY18E
FY17E
FY18E
FY17E
FY18E
FY17E
FY18E
FY17E
FY18E
FY17E
FY18E
zOthers
Nilkamal
Neutral
1,264
-
1,886
1,995
2,165
10.7
10.4
69.8
80.6
18.1
15.7
72.2
62.7
16.6
16.5
0.9
0.8
Visaka Industries
Neutral
159
-
252
1,051
1,138
10.3
10.4
21.0
23.1
7.6
6.9
20.4
19.1
9.0
9.2
0.5
0.5
Transport Corporation of
Neutral
189
-
1,448
2,671
2,911
8.5
8.8
13.9
15.7
13.7
12.1
1.9
1.7
13.7
13.8
1.2
1.1
India
Elecon Engineering
Accumulate
56
63
612
1,482
1,660
13.7
14.5
3.9
5.8
14.4
9.7
3.4
3.1
7.8
10.9
0.8
0.7
Surya Roshni
Accumulate
183
201
802
3,342
3,625
7.8
7.5
17.3
19.8
10.6
9.3
20.1
16.1
10.5
10.8
0.5
0.4
MT Educare
Neutral
138
-
548
366
417
17.7
18.2
9.4
10.8
14.7
12.7
3.3
2.8
22.2
22.3
1.5
1.3
Radico Khaitan
Buy
97
125
1,284
1,659
1,802
13.0
13.2
6.3
7.4
15.2
13.1
1.3
1.2
8.6
9.3
1.2
1.1
Garware Wall Ropes
Accumulate
481
524
1,053
873
938
12.9
13.1
30.9
34.9
15.6
13.8
2.5
2.1
15.7
15.2
1.2
1.1
Wonderla Holidays
Neutral
404
-
2,282
287
355
38.0
40.0
11.3
14.2
35.7
28.4
5.1
4.5
21.4
23.9
7.7
6.2
Linc Pen & Plastics
Neutral
275
-
407
382
420
9.3
9.5
13.5
15.7
20.5
17.5
3.5
3.0
17.1
17.3
1.2
1.0
The Byke Hospitality
Neutral
159
-
636
287
384
20.5
20.5
7.6
10.7
20.9
14.8
4.4
3.5
20.7
23.5
2.3
1.7
Interglobe Aviation
Neutral
869
-
31,319
21,122
26,005
14.5
27.6
110.7
132.1
7.9
6.6
47.0
33.6
168.5
201.1
1.5
1.2
Coffee Day Enterprises
Neutral
244
-
5,020
2,964
3,260
20.5
21.2
4.7
8.0
-
30.5
2.8
2.6
5.5
8.5
2.2
1.9
Ltd
Navneet Education
Neutral
103
-
2,454
1,062
1,147
24.0
24.0
6.1
6.6
16.9
15.6
3.5
3.1
20.6
19.8
2.4
2.3
Navkar Corporation
Buy
201
265
2,864
408
612
42.9
42.3
6.8
11.5
29.7
17.5
2.1
1.8
6.9
10.5
7.8
5.2
UFO Moviez
Neutral
480
-
1,326
619
685
33.2
33.4
30.0
34.9
16.0
13.8
2.2
1.9
13.8
13.9
1.9
1.5
VRL Logistics
Neutral
294
-
2,683
1,902
2,119
16.7
16.6
14.6
16.8
20.2
17.5
4.4
3.9
21.9
22.2
1.5
1.3
Team Lease Serv.
Neutral
1,130
-
1,932
3,229
4,001
1.5
1.8
22.8
32.8
49.6
34.4
5.3
4.6
10.7
13.4
0.5
0.4
S H Kelkar & Co.
Neutral
326
-
4,709
1,036
1,160
15.1
15.0
6.1
7.2
53.3
45.4
5.7
5.2
10.7
11.5
4.0
3.5
Quick Heal
Neutral
235
-
1,646
408
495
27.3
27.0
7.7
8.8
30.4
26.7
2.8
2.8
9.3
10.6
3.2
2.7
Narayana Hrudaya
Neutral
316
-
6,453
1,873
2,166
11.5
11.7
2.6
4.0
119.4
79.6
7.3
6.6
6.1
8.3
3.5
3.0
Manpasand Bever.
Neutral
749
-
3,749
836
1,087
19.6
19.4
16.9
23.8
44.3
31.5
5.3
4.6
12.0
14.8
4.1
3.1
Parag Milk Foods
Neutral
308
-
2,589
1,919
2,231
9.3
9.6
9.5
12.9
32.6
23.8
5.1
4.2
15.5
17.5
1.5
1.3
Source: Company, Angel Research; Note: *December year end; #September year end; &October year end; Price as on August 29, 2016
Market Outlook
August 30, 2016
Research Team Tel: 022 - 39357800
DISCLAIMER
Angel Broking Private Limited (hereinafter referred to as “Angel”) is a registered Member of National Stock Exchange of India Limited,
Bombay Stock Exchange Limited and Metropolitan Stock Exchange Limited. It is also registered as a Depository Participant with CDSL
and Portfolio Manager with SEBI. It also has registration with AMFI as a Mutual Fund Distributor. Angel Broking Private Limited is a
registered entity with SEBI for Research Analyst in terms of SEBI (Research Analyst) Regulations, 2014 vide registration number
INH000000164. Angel or its associates has not been debarred/ suspended by SEBI or any other regulatory authority for accessing
/dealing in securities Market. Angel or its associates/analyst has not received any compensation / managed or co-managed public
offering of securities of the company covered by Analyst during the past twelve months.
This document is solely for the personal information of the recipient, and must not be singularly used as the basis of any investment
decision. Nothing in this document should be construed as investment or financial advice. Each recipient of this document should make
such investigations as they deem necessary to arrive at an independent evaluation of an investment in the securities of the companies
referred to in this document (including the merits and risks involved), and should consult their own advisors to determine the merits and
risks of such an investment.
Reports based on technical and derivative analysis center on studying charts of a stock's price movement, outstanding positions and
trading volume, as opposed to focusing on a company's fundamentals and, as such, may not match with a report on a company's
fundamentals. Investors are advised to refer the Fundamental and Technical Research Reports available on our website to evaluate the
contrary view, if any.
The information in this document has been printed on the basis of publicly available information, internal data and other reliable
sources believed to be true, but we do not represent that it is accurate or complete and it should not be relied on as such, as this
document is for general guidance only. Angel Broking Pvt. Limited or any of its affiliates/ group companies shall not be in any way
responsible for any loss or damage that may arise to any person from any inadvertent error in the information contained in this report.
Angel Broking Pvt. Limited has not independently verified all the information contained within this document. Accordingly, we cannot
testify, nor make any representation or warranty, express or implied, to the accuracy, contents or data contained within this document.
While Angel Broking Pvt. Limited endeavors to update on a reasonable basis the information discussed in this material, there may be
regulatory, compliance, or other reasons that prevent us from doing so.
This document is being supplied to you solely for your information, and its contents, information or data may not be reproduced,
redistributed or passed on, directly or indirectly.
Neither Angel Broking Pvt. Limited, nor its directors, employees or affiliates shall be liable for any loss or damage that may arise from
or in connection with the use of this information.